Looking for a Tutor Near You?

Post Learning Requirement » x
Ask a Question
x

Choose Country Code

x

Direction

x

Ask a Question

x

Hire a Tutor

UV Spectroscopy

Published in: Chemistry
51,906 Views

Presentation on UV Spectroscopy.

Trinity A / Chandigarh

year of teaching experience

Qualification:

Teaches: Indian National Mathematical Olympiad (INMO), Mental Maths, Olympiad Exam Preparation, Regional Mathematical Olympiad (RMO), Advanced Excel, Basic Computer, MS Office, School Level Computer, Mathematics, Statistics, Science, Social Studies, B.Tech Tuition, Drawing, Mechanical, AutoCAD Training, French, German, Study in Germany

Contact this Institute
  1. UV VISIBLE SPECTROSCOPY
  2. Spectroscopy • It is the branch of science that deals with the study of interaction of matter with light. OR • It is the branch of science that deals with the study of interaction of electromagnetic radiation with matter.
  3. SPECTROSCOPY "The study of interaction of electromagnetic radiation with molecules/atoms Types: 1 )Absorption Spectroscopy: The study of absorbed radiation by molecule , in the of spectra. orm Eg: UV, IR, NMR, colorimetry, tomic absorption spectroscopy 2) Emission Spectroscopy: The radiation emitted by molecules can also be studied to reveal the structure of molecule. Eg:flame photometry, flourimetry
  4. Study of spectroscopy Atomic spectroscopy: interaction of EMR+ATOMS Changes in energy take place at atomic level Eg: atomic absorption spectroscopy, flame photometry Molecular spectroscopy: Interaction of EMR + molecules Changes in energy take place at molecular level Eg: UV, IR, colorimetry Results in transitions between vibrational,& rotational energy levels
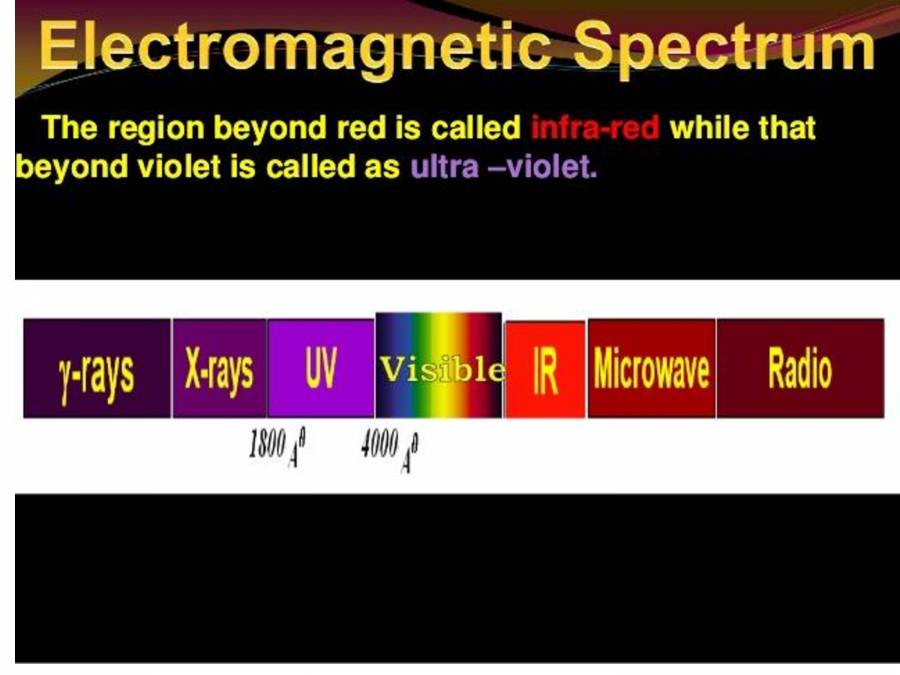
  5. Electromagnetic Spectrum The region beyond red is called infra-red while that beyond violet is called as ultra —violet. y•rays X.rays UV IR Microwave Radio
  6. THE ELECTROMAGNETIC SPECTRUM too 1.4 4.3 12 800-3333 cm infrared 333-3333 cm ' 620 1.6 4.8 I 580 1.7 5.2 530 1.9 5.7 I 470 2.1 6.4 I uttra. violet Radiofrequeccy Micro- wave 420 rvn 2.4 10' cm 7.1 Vacuum uttravidet X-rays, y-rays Jog(vtHz) 21 3 km magnetism 30 cm 3mm 0.03 mm Rotation Vitration 300 rvn 3 nm Electronic 3 pm Nucloar
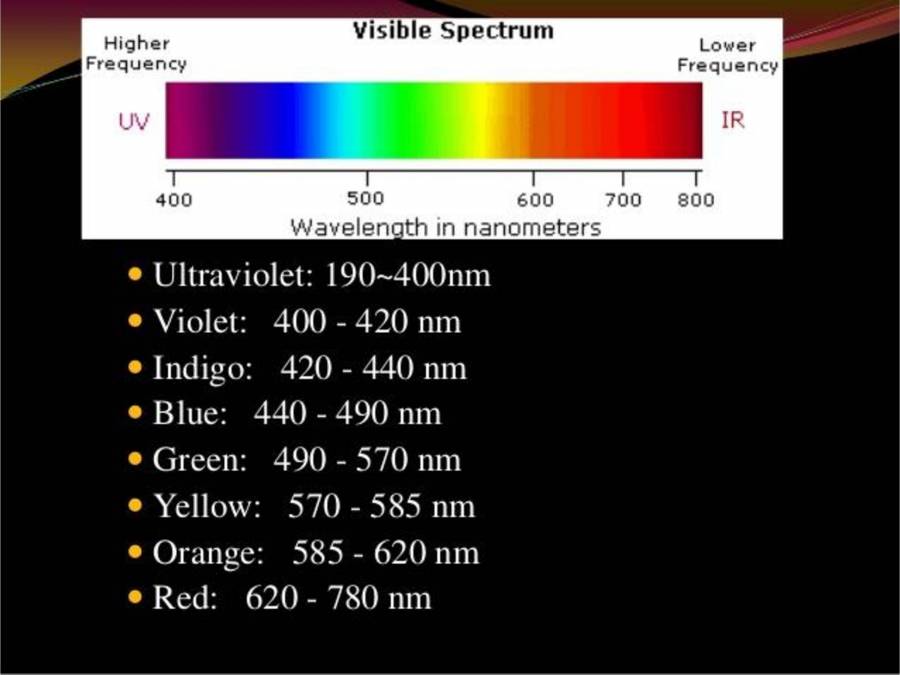
  7. Visible Spectrum Higher Frequency uv 400 soo 600 700 Lower Frequency IR goo Wavelenath in nanometers o Ultraviolet: 190-400nm Violet: 400 - 420 nm • Indigo: 420 - 440 nm • Blue: 440 - 490 nm • Green: 490 - 570 nm • Yellow: 570-585 nm o Orange: 585 - 620 nm • Red: 620 - 780 nm
  8. THEORY INVOLVED When a beam of light falls on a solution or homogenous media ,a portion of light is reflected ,from the surface of the media, a portion is absorbed within the medium and remaining is transmitted through the medium. • Thus if 10 is the intensity of radiation falling on the media Ir is the amount of radiations reflected, la is the amount of radiation absorbed & It the amount of radiation transmitted then 10-1
  9. ABSORPTION LAWS oLambert's law o Beer'S law 0Beer-lambert's law
  10. LAMBERT'S LAW When a beam of monochromatic light is passed through a homogenous absorbing medium, the rate of decrease of intensity of radiation With thickness of absorbing medium is proportional to the intensity of the incident light (radiation) . dl/dt = Kl intensity of incident light of wavelength Å t= thickness of medium On integrating the equation & putting 1=10 • We get In 10/ It =kt -kt 10 = denotes the intensity of incident light It =denotes the intensity of transmitted light K= constant which depend on Å & absorbing medium Convert the equation into natural logarithms i.e. 10 base 10 • It = 10 10-0.4343kt= 10 10-kt
  11. BEER'S LAW • Intensity of a beam of monochromatic light decreases exponentially with increase in conc. Of absorbing substance arithmetically. -kc • It = 1 10-0.4343kc = 1 10-kc
  12. BEER-LAMBERT'S LAW • On combing the two laws, the beer-lambert law can be formulated as below log 10/1 =€.c.l 10 -intensity of incident light • I = intensity of transmitted lig € —molar extinction co-efficiel C=conc. Of solution • path length of sample • A = absorbance 0/0T_ —t- x 100 vette Sample depth
  13. LIMITATIONS &DEVIATIONS • keto-enol tautomers • fluorescent compounds • solute & solvent form complexes Deviations from beer-lambert's law • Real deviations • Instrumental deviations • Chemical deviations
  14. PRINCIPLE UV-visible spectroscopy measure the response of a sample to ultra violet and visible range of electromagnetic radiation. Molecules have either n,TC or Electrons. These electrons absorb UV radiation & undergoes transitions from ground state to excited state.
  15. THE ABSORPTION SPECTRUM The absorption of uv radiation brings about the promotion of an electron from bonding to antibonding orbital. The wavelength of radiation is slowly changed from minimum to maximum in the given region, and the absorbance at every wavelength is recorded. Then a plot of energy absorbed Vs wavelength is called absorption spectrum. The significant features: Xmax (wavelength at which there is a maximum absorption) emax (The intensity of maximum absorption) The UV spectrum depends on solvents concentr i n f olution
  16. ors oos ost tuti = Ote- .vmu lloyd.tosqv
  17. zObserved electronic transitions Here is a graphical representation Atomic orbital Energy n Molecular orbitals Unoccupied levels Atomic orbital Occupied levels 21
  18. Different types qf Excitations l)o- o* Transition 2) it-TC* Transition 3)n- o* Transition 4)n- Transition
  19. Different types of Excitations n Antibonding Antibonding Nonbonding Bonding Bonding
  20. TYPES OF TRANSITIONS ALLOWED TRANSITIONS • The transitions with the values of extinction co- efficient more than 104 are usually called allowed transitions. • They generally arise due to Tt-Tt* Transition . • Eg: In 1,3-butadiene molar extinction co-efficient is very high i.e.21000
  21. TYPES OF TRANSITIONS 2)FORBlDDEN TRANSITIONS: • These transitions are as a result of the excitation of one electron from the lone pair present on the hetero atom to an anti bonding orbital. • Eg: carbonyl compounds • Molar extinction co-efficient value is 1 04
  22. CHROMOPHORES Bathochromic shift (red shift) — a shift to longer wavelength; lower energy • Hypsochromic shift (blue shift) — shift to shorter wavelength; higher energy • Hyperchromic effect — an increase in intensity • Hypochromic effect — a decrease in intensity
  23. HYPERCHROM)C HYPSOCHROMIC - - - —BATH)CHROMIC HYPO - ROMtC Figure 11•3 Terminology of shifts in the position of an absorption bond.
  24. Chromophore c-x X=Br, I Excitation 7t-........+7t T......--»at Imax, nm 171 290 180 275 200 205 255 Solvent hexane hexane hexane ethanol ethanol hexane
  25. Chromophore X=Br, I Excitation 7t-........-.>7t 7t-......-.>7t imax, nm 171 290 180 275 200 205 255 Solvent hexan e hexan e hexane ethanol ethanol hexan e hexan e
  26. 1. 2. The construction of a traditional UV-VIS spectrometer is very similar to an IR, as similar functions — sample handling, irradiation, detection and output are required Here is a simple schematic that covers most modern UV spectrometers: log(ldl) = A UV-VIS sources 200 monochromator/ beam splitter optics 700
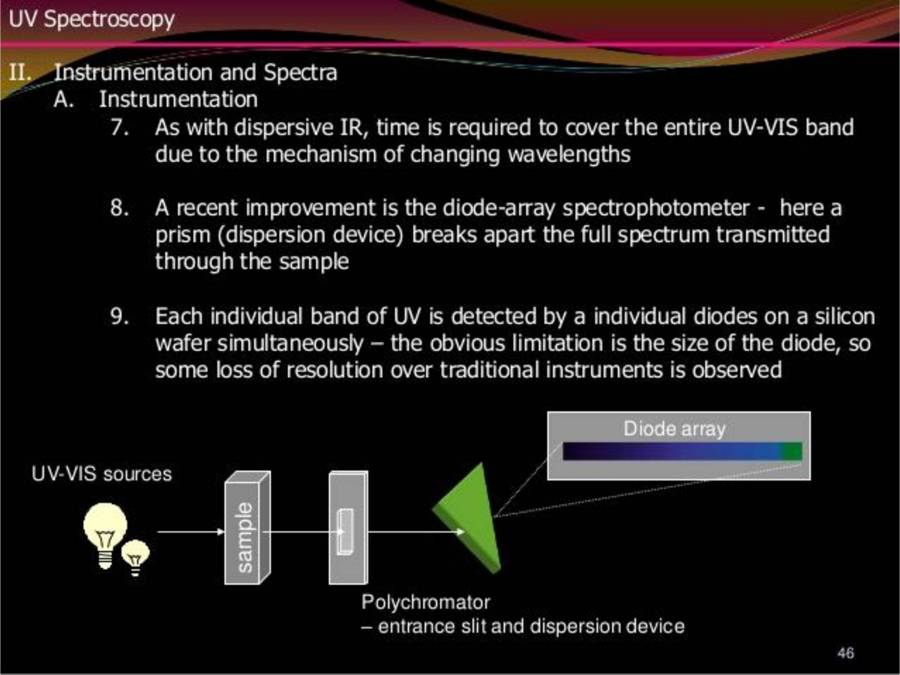
  27. UV Spectroscopy and Spectra A. Instrumentation 7. 8. 9. As with dispersive IR, time is required to cover the entire UV-VIS band due to the mechanism of changing wavelengths A recent improvement is the diode-array spectrophotometer - here a prism (dispersion device) breaks apart the full spectrum transmitted through the sample Each individual band of UV is detected by a individual diodes on a silicon wafer simultaneously — the obvious limitation is the size of the diode, so some loss of resolution over traditional instruments is observed I-IV-VIS sources E Diode array Polychromator — entrance slit and dispersion device 46
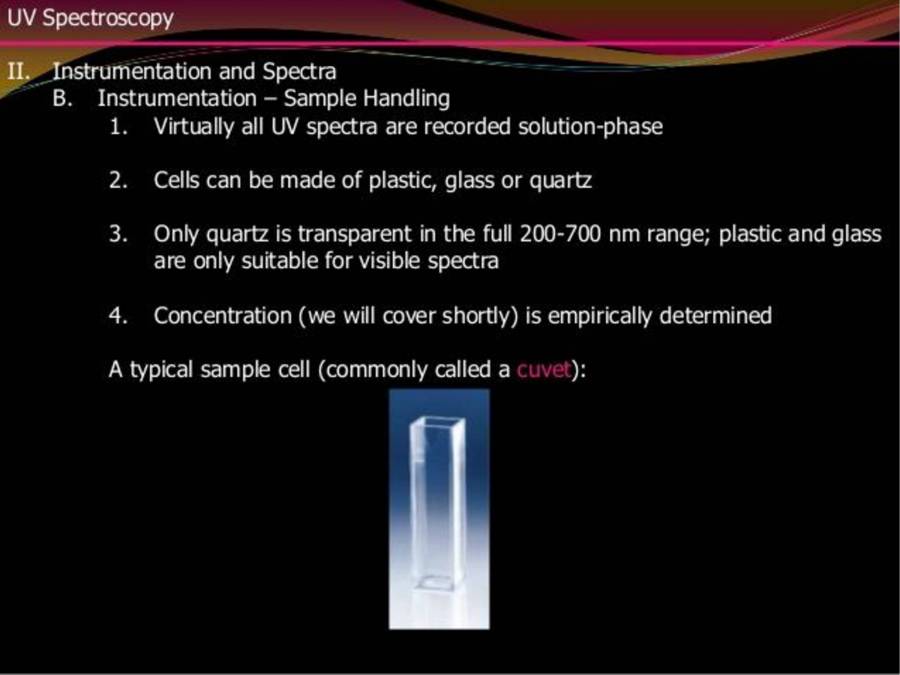
  28. UV Spectroscopy Il,zlnstrumentation and Spectra B. Instrumentation — Sample Handling 1. 2. 3. 4. Virtually all UV spectra are recorded solution-phase Cells can be made of plastic, glass or quart Only quartz is transparent in the full 200-700 nm range; plastic and glass are only suitable for visible spectra Concentration (we will cover shortly) is empirically determined A typical sample cell (commonly called a cuvet)
  29. UV Spectroscopy Ill. Chromophores A. Definition 1. 2. 3. 4. Remember the electrons present in organic molecules are involved in covalent bonds or lone pairs of electrons on atoms such as O or N Since similar functional groups will have electrons capable of discrete classes of transitions, the characteristic energy of these energies is more representative of the functional group than the electrons themselves A functional group capable of having characteristic electronic transitions is called a chromophore (color loving) Structural or electronic changes in the chromophore can be quantified and used to predict shifts in the observed electronic transitions
  30. UV Spectroscopy Ill.Chromophores c. General — from our brief study of these general chromophores, only the weak n transition occurs in the routinely observed The attachment of substituent groups (other than H) can shift the energy of the transition Substituent's that increase the intensity and often wavelength of an absorption are called auxochromes Common auxochromes indude alkyl, hydroxyl, alkoxy and amino groups and the halogens